
After having some issues with latency on a data store i decided to look a little deeper and after a few google searches found this was the best way to find the culprit or at least begin to. Im not going to go into massive detail just how to get to the bottom of it.
First saw the issue in VEEAM ONE but this only gives you an overview and doesnt go deep enough, next up was to view the perfomance in vCentre itself but same issue couldnt really dig deep enough so below is what i did to find my issue, breaking it down to first HBA, then LUN, then actual machine.
So latency between 15ms and 20ms is acceptable, anything over is deemed bad.
Configuring monitoring using esxtop
To monitor storage performance per HBA:
- Start esxtop by typing esxtop at the command line.
- Press d to switch to disk view (HBA mode).
- To view the entire Device name, press SHIFT + L and enter 36 in Change the name field size.
- Press f to modify the fields that are displayed.ESXTOP
- Press b, c, d, e, h, and j to toggle the fields and press Enter.
- Press s and then 2 to alter the update time to every 2 seconds and press Enter.
To monitor storage performance on a per-LUN basis:
- Start esxtop by typing esxtop from the command line.
- Press u to switch to disk view (LUN mode).
- Press f to modify the fields that are displayed.
- Press b, c, f, and h to toggle the fields and press Enter.
- Press s and then 2 to alter the update time to every 2 seconds and press Enter.
the diagram below helps break down the latency from ESXTOP columns to where its actually happening in VMWare
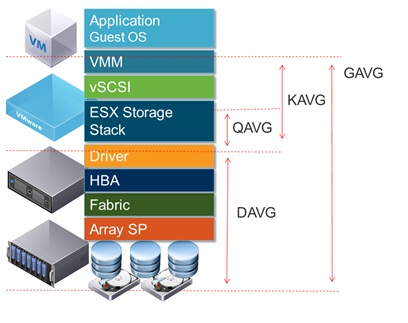
GAVG (Guest Average Latency) total latency as seen from vSphere
KAVG (Kernel Average Latency) time an I/O request spent waiting inside the vSphere storage stack.
QAVG (Queue Average latency) time spent waiting in a queue inside the vSphere Storage Stack.
DAVG (Device Average Latency) latency coming from the physical hardware, HBA and Storage device.
Indicators of bad storage performance?
• High Device Latency: Device Average Latency (DAVG) consistently greater than 20 to 30 ms may cause a performance problem for your typical application.
• High Kernel Latency: Kernel Average Latency (KAVG) should usually be 0 in an ideal environment, but anything greater than 2 ms may be a performance problem.
And finally to monitor storage performance on a per-virtual machine basis:
- Start esxtop by typing esxtop at the command line.
- Type v to switch to disk view (virtual machine mode).
- Press f to modify the fields that are displayed.
- Press b, d, e, h, and j to toggle the fields and press Enter.
- Press s and then 2 to alter the update time to every 2 seconds and press Enter.